CloudWatch Alarms - Hands On
Alarms aren't just passive indicators; they are active, self-healing security guards for your infrastructure. This hands-on lab will automate EC2 termination when a critical threshold is breached.
Hands On
🛠️ Step-by-Step EC2 Auto-Termination Console Playbook
Provisioning the Target Resource
- Step 1: Launch a Sacrifice VM
- Go to the EC2 Dashboard, hit Launch Instance, and spin up a quick
t3.microinstance. - Copy the newly generated
Instance IDstring to your clipboard.
- Go to the EC2 Dashboard, hit Launch Instance, and spin up a quick
Wiring the Threshold Gate
-
Step 2: Initialize the Alarm Core
-
Navigate to CloudWatch ──► click Alarms ──► select Create alarm.
-
Click Select metric ──► drill into EC2 ──► Per-Instance Metrics. Paste your Instance ID and select CPUUtilization.
-
Step 3: Define the Math Resolution
- Statistic: Set to
Average. - Period: Set to
5 minutes(matches the standard baseline hypervisor monitoring frequency).
- Statistic: Set to
-
Step 4: Establish the Breach Boundaries
- Threshold Type:
Static. - Alarm Condition:
Greater than 95. - Datapoints to Alarm: Set to
3 out of 3. (This tells CloudWatch: "This machine must stay completely pinned above 95% CPU for 3 consecutive 5-minute evaluation windows—15 minutes straight—before tripping the gate.") Click next.
- Threshold Type:
Setting the Kill Switch (EC2 Action)
-
Step 5: Configure the Auto-Remediation Target
- Under the Notification panel, delete default SNS notifications if you want to skip email noise.
- Click Add EC2 action.
- Alarm State Trigger: Select
In alarm. - Execution Directive: Choose
Terminate this instance. Click next.
-
Step 6: Name and Provision
- Name the configuration
terminate-EC2-on-high-CPU, review the blueprint summary layout, and hit Create alarm.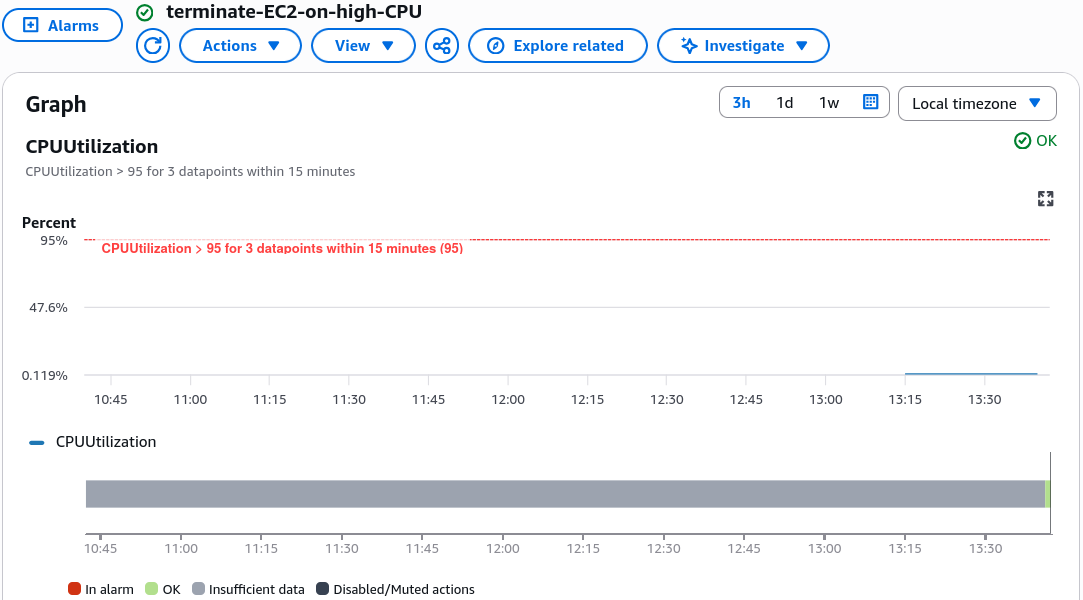
- Name the configuration
🏎️ Accelerating the Incident Test Loop (set-alarm-state)
The alarm will initially sit in the INSUFFICIENT_DATA status block while it waits for initial hypervisor metrics. Instead of running a heavy CPU stress-test command on the server and waiting 15 minutes for the timer loops to expire, you can simulate a high-CPU incident instantly via AWS CloudShell.
-
Step 1: Fire the Synthetic Breach
- Boot up CloudShell and execute this exact structural API command string:
aws cloudwatch set-alarm-state \--alarm-name "terminate-EC2-on-high-CPU" \--state-value ALARM \--state-reason "Manual engineering verification of EC2 auto-kill switch" -
Step 2: Audit the Execution History
- Refresh your CloudWatch Alarms dashboard UI. Observe the state indicator flag flip instantly to a bright red
In alarmstatus grid block. - Click the History tab. You will see CloudWatch log an automated state transition event immediately followed by an execution response confirming the
TerminateInstanceaction was delivered successfully.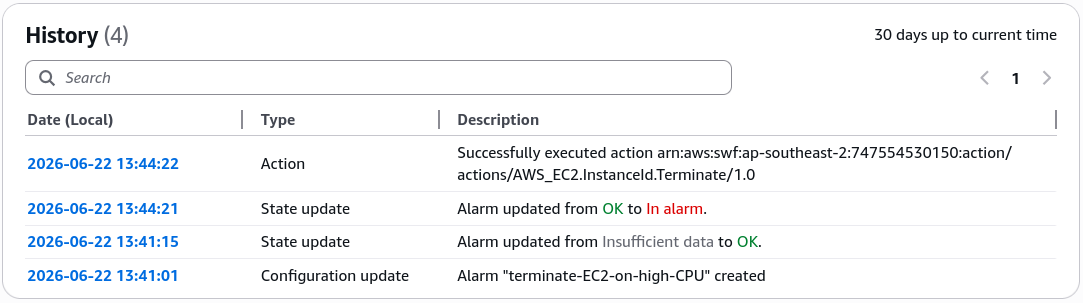
- Refresh your CloudWatch Alarms dashboard UI. Observe the state indicator flag flip instantly to a bright red
-
Step 3: Confirm the Kill
- Jump back over to your EC2 Instances Console. Refresh the grid dashboard. You will see your sacrifice virtual machine instantly transition to
shutting-downand thenterminatedflawlessly!
- Jump back over to your EC2 Instances Console. Refresh the grid dashboard. You will see your sacrifice virtual machine instantly transition to