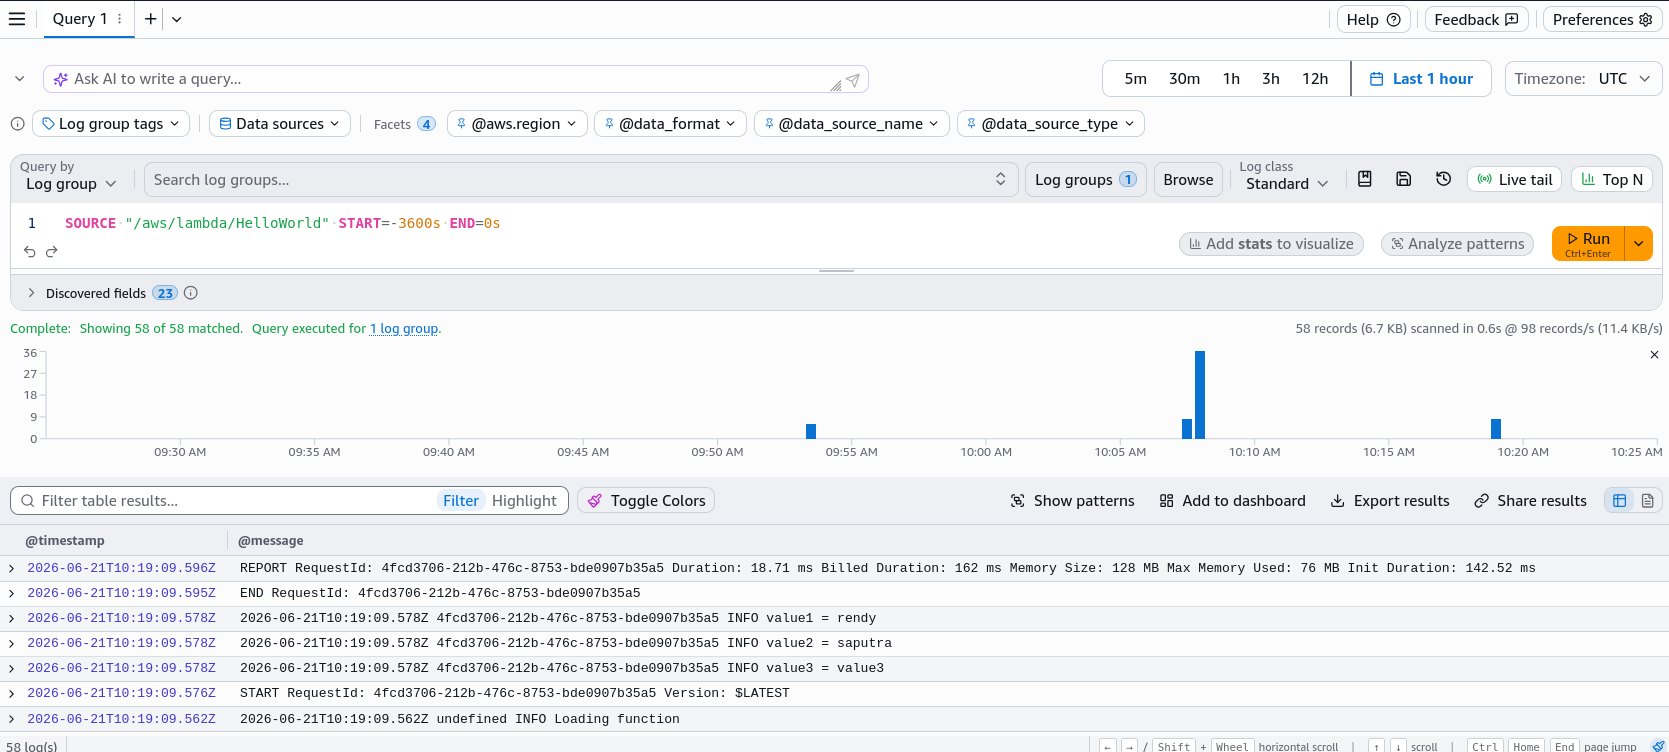
CloudWatch Logs - Hands On
Step-by-Step CloudWatch Logs Console Walkthrough
Hands on
Provisioning & Tracking Infrastructure
-
Step 1: Explore Log Groups
- Go to CloudWatch ──► click Log Management under the Logs section on the left sidebar menu.
- Pro-Tip: Native AWS service logs are automatically prefixed (e.g.,
/aws/lambda/HelloWorld), while custom application logs sit under user-defined labels (e.g.,demo-logs).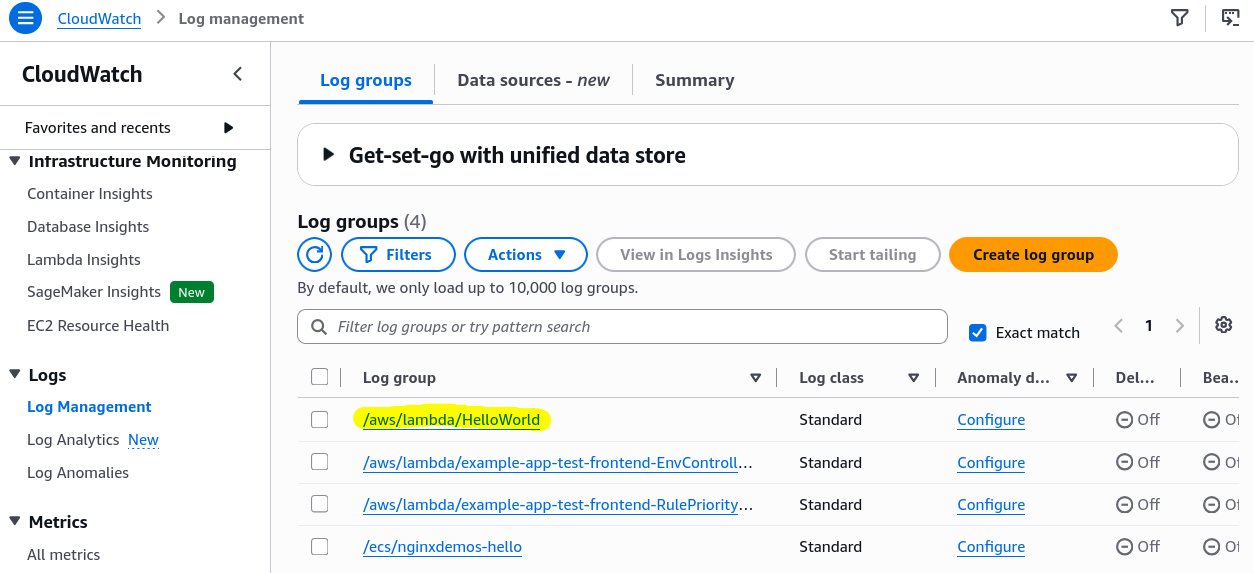
-
Step 2: Inspect Log Streams
- Click into an active log group to view individual Log Streams. Each stream represents a unique runtime compute instance (like a specific Lambda invocation environment runner).
- Click a stream to check individual line logs containing automated timestamps and custom application print execution string arrays (
info,error, etc.).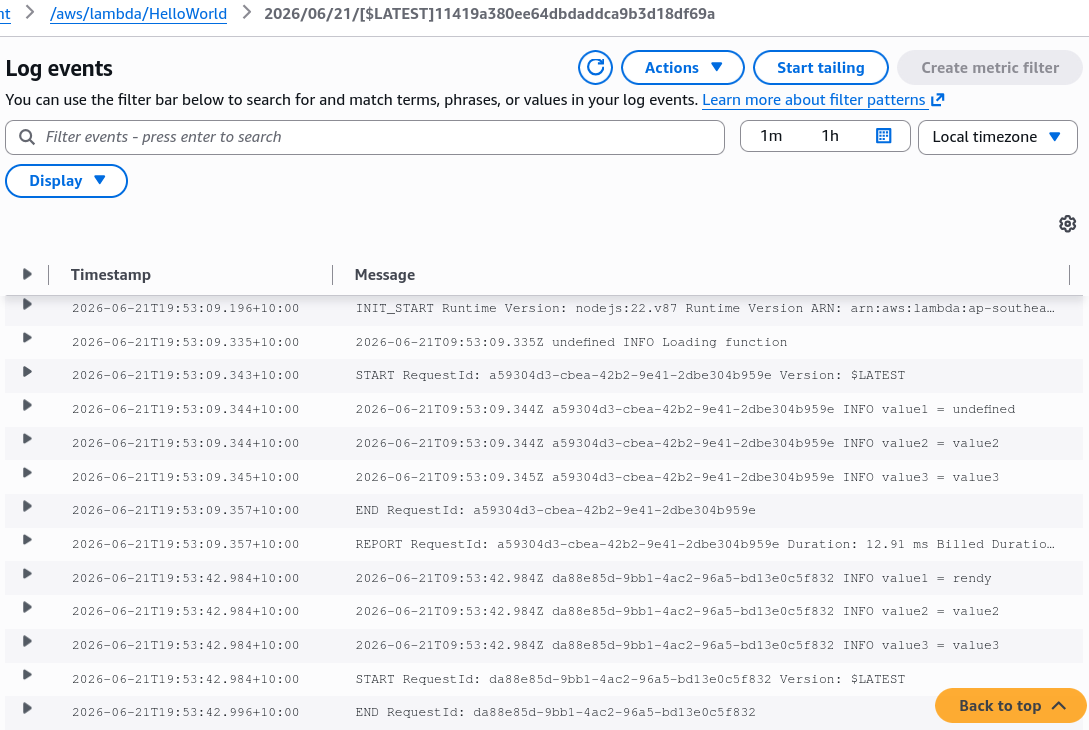
Building a Metric Filter Shield (Turning Text into Math)
-
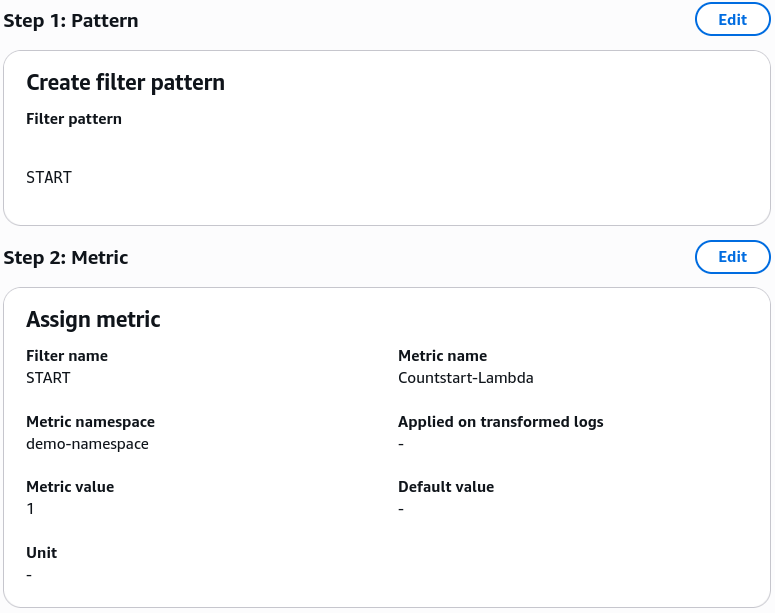
Step 3: Define Your Ingestion Pattern Match
- Inside your chosen Log Group panel, select the Metric filters tab and click Create metric filter.
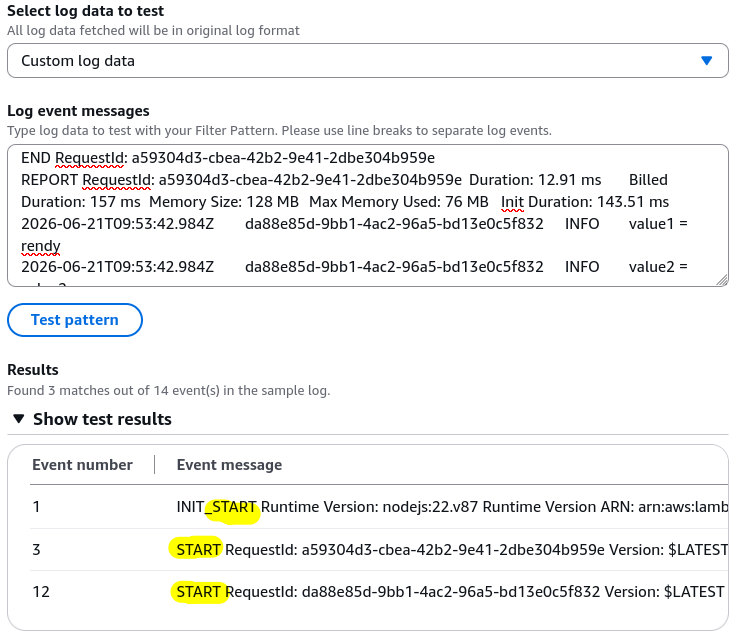
- Enter your tracking string parameter in the Filter pattern text box (e.g., typing
STARThandles tracking anytime your Lambda function boots up). - Click Test pattern to run a simulation against your historical stream history to ensure it extracts lines cleanly.
-
Step 4: Map the Numeric Metrics Data Matrix
- Metric Namespace: Set to a custom workspace string (e.g.,
demo-namespace). - Metric Name: Set your metric identifier label (e.g.,
Countstart-Lambda). - Metric Value: Set to 1. This tells CloudWatch: “Every single time you match this text pattern, increment our new metric counter graph by exactly 1.” Hit save.
- Metric Namespace: Set to a custom workspace string (e.g.,
Validating the Alert Pipeline
- Step 5: Fire Test Triggers
- Head over to your Lambda console and click the Test execution button 4 or 5 times back-to-back.
- Step 6: Chart the Custom Graph
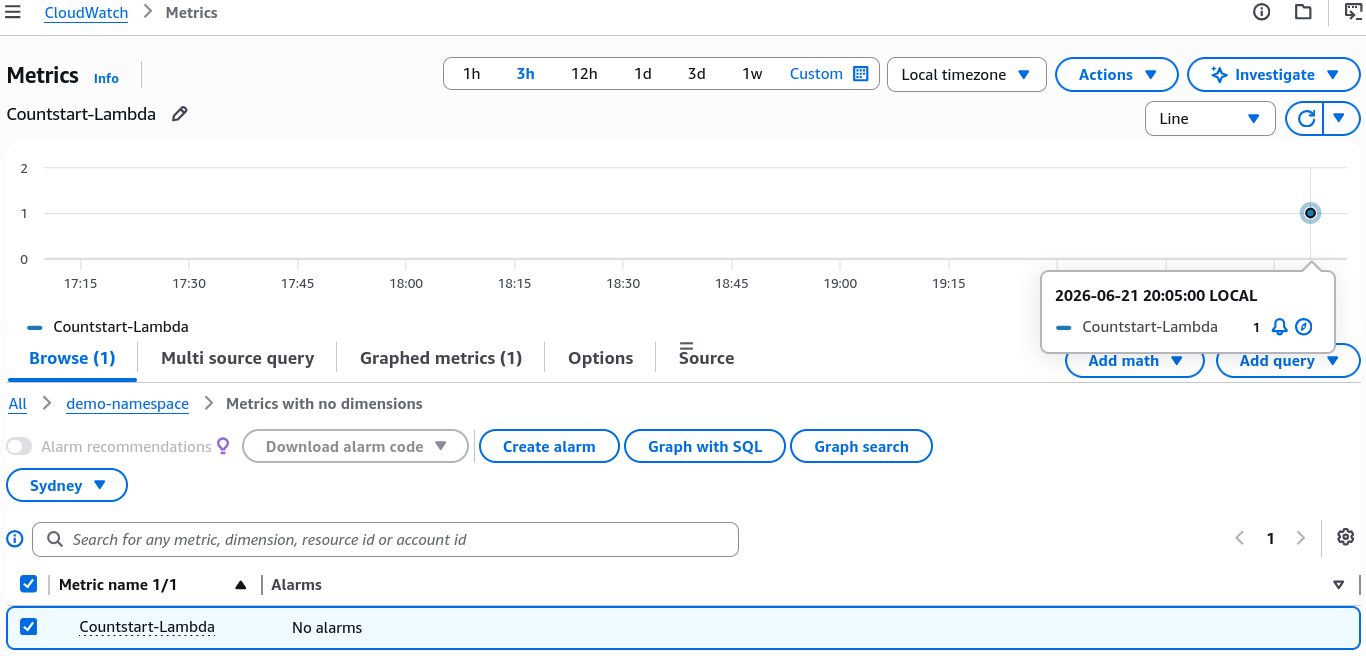
- Return to CloudWatch Metrics ──► click your custom namespace (
demo-namespace). - The Real-Time Latency Lock: Observe your graph line chart update with a new numeric data spike marker. Custom metric filters are not retroactive; they only plot incoming text events moving forward.
- Return to CloudWatch Metrics ──► click your custom namespace (
- Step 7: Attach a Production Threshold Alarm
- Click Create alarm directly off your newly charted metric data point line.
- Define your operational rules (e.g., “If the occurrences of
Countstart-Lambdaexceed 10 within a 5-minute tracking window, immediately flip the state indicator flag over to ALARM to notify our team.”)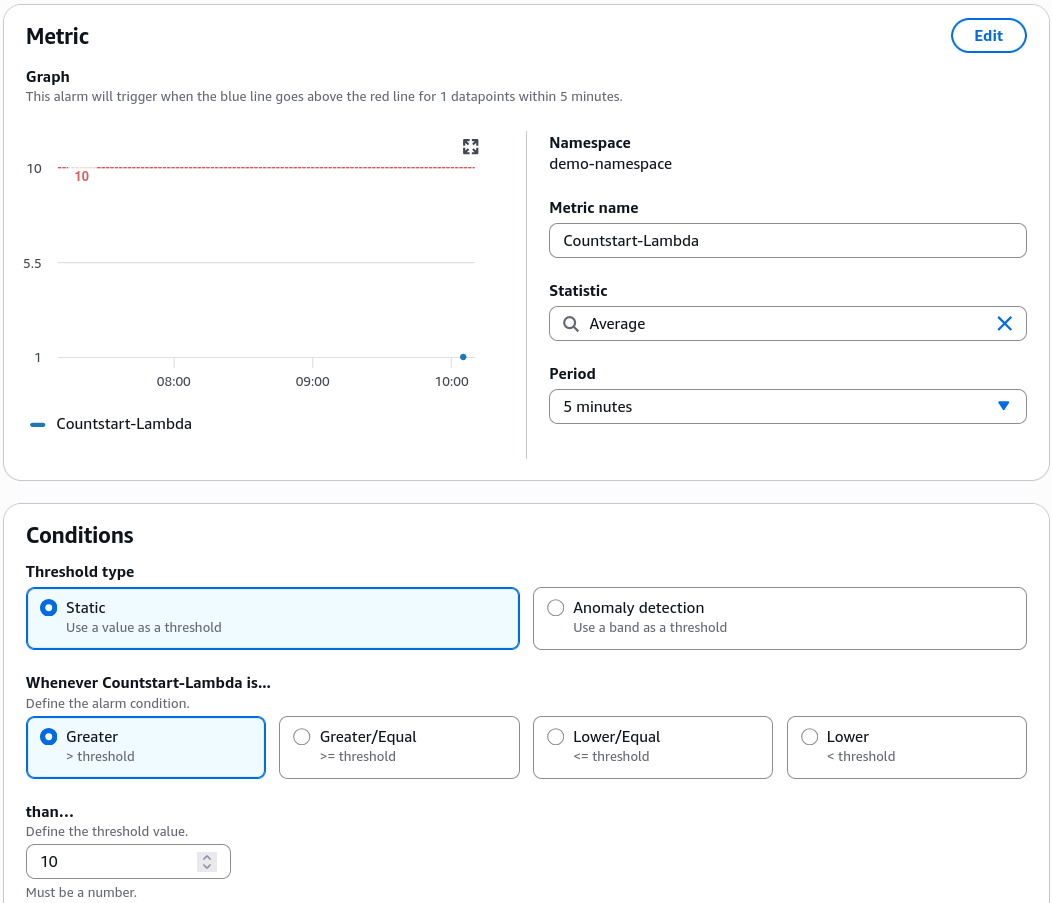
Pipeline Routing
This structural lifecycle maps out exactly how text files are converted into numeric dashboard metrics and continuous real-time notification gates:
 ┌──────────────────────────────────────────────┐
 │     Application Log Stream Ingestion         │ ──► Raw text entries flow into SQS/Lambda
 └──────────────────────┬───────────────────────┘
                        │
                        ▼
 ┌──────────────────────────────────────────────┐
 │      CloudWatch Logs Metric Filter           │ ──► Parses incoming text string lines
 └──────────────────────┬───────────────────────┘     against custom patterns (e.g., "START")
                        │
             (⏱️ Matching Event Occurs)
                        │
                        ▼
 ┌──────────────────────────────────────────────┐
 │        Custom Time-Series Metric             │ ──► Increments numeric counter tracking map
 └──────────────────────┬───────────────────────┘     inside user namespace environment
                        │
                        ▼
 ┌──────────────────────────────────────────────┐
 │         CloudWatch Threshold Alarm           │ ──► Fires horizontal autoscaling rules or
 └──────────────────────────────────────────────┘     sends SNS notifications if limit is breached
Summary of Advanced Operations Mapped in the Lab
- Tailing Logs: Clicking Start tailing gives you a continuous stream of logs scrolling down your screen in real time as they are generated by workers.
- Retention Settings: You can set your log groups to automatically expire after a certain number of days (e.g., 7, 30, 90) or choose to never expire them for permanent storage.
- Subscription Filters: The architectural hook used to branch out out-of-the-box streaming logs straight to four primary processing endpoints: OpenSearch Service, Kinesis Data Streams, Amazon Data Firehose, or AWS Lambda.
- Logs Insights QL: A historical data analyzer using a purpose-built syntax. You can select pre-made query templates (like “Find the top 25 most recent errors/exceptions”) to visually plot exceptions or measure performance metrics over time across different accounts.