CloudWatch Logs - Metric Filters Hands On
Tracking down HTTP error codes and transforming them from raw text noise into mathematical graphs shows the true power of the CloudWatch control plane.
Hands On
Ingestion Pattern Matching
-
Step 1: Locate the Web Logs
- Navigate to CloudWatch ──► click Log groups on the left menu.
- Select your target web server log repository (e.g., your Elastic Beanstalk Nginx access log group).
-
Step 2: Initialize the Filter Engine
- Click Actions ──► select Create metric filter (or jump to the Metric filters tab and hit create).
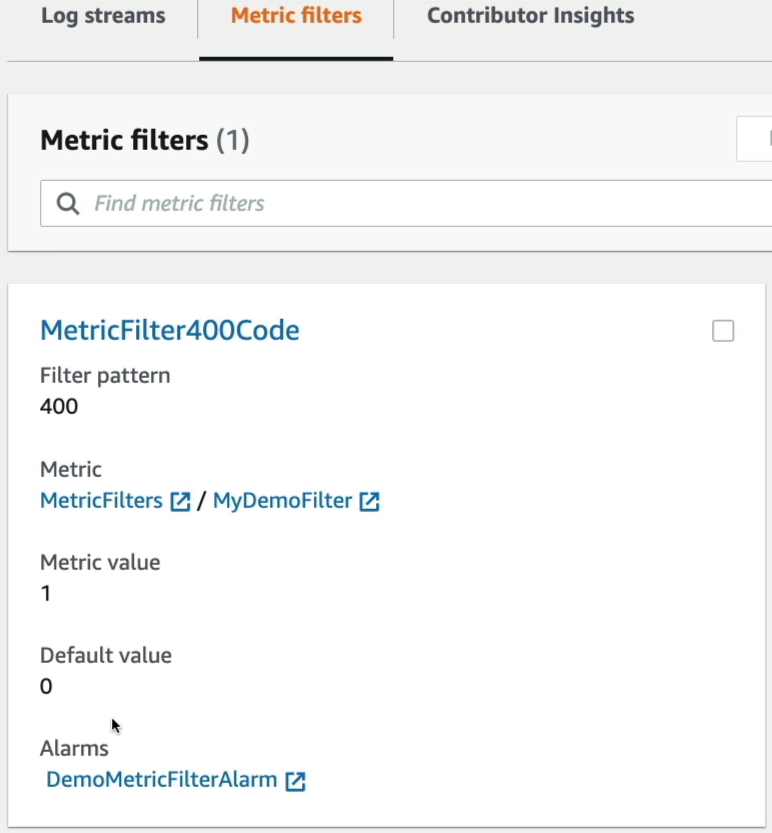
- Filter Pattern: Type
400(This basic token parser screens incoming raw text strings for the exact HTTP 400 error code sequence).
-
Step 3: Run the Ingestion Simulation
- Scroll down to the test panel, select your target log stream under the sample data layout dropdown, and hit Test pattern.
- Verify the console highlights the matching lines (e.g., identifying
14 matches out of 50 events), proving your regex pattern rules are functioning perfectly. Click next.
Mapping the Time-Series Data Matrix
- Step 4: Provision the Metric Coordinates
- Filter Name: Set to
MetricFilter400Code. - Metric Namespace: Input a custom folder string (e.g.,
MetricFilters). - Metric Name: Name the graph tracker (e.g.,
MyDemoFilter). - Metric Value: Enter
1(increments the timeline plot by 1 for each matched log line). - Default Value: Enter
0(ensures a clean baseline continuous graph line even when no errors occur). Click next and hit Create metric filter.
- Filter Name: Set to
Validating and Arming the Alarm Gate
-
Step 5: Trigger Live Data Traffic
- The Non-Retroactive Check: Head to your custom namespace graph inside All metrics. Notice it does not backfill historical 400 errors from earlier in the day. It starts completely fresh.
- Jump over to your Elastic Beanstalk Console, select your application environment, click Actions, and hit Restart app servers (or hit
/testURLs rapidly) to force a burst of fresh log activity down the pipe.
-
Step 6: Attach the Production Threshold Guardrail
- Return to your metric filter configuration page and click Create alarm directly off your custom
MyDemoFiltermetric. - Metric Conditions: Set the evaluation rule to Static ──► Threshold logic: Greater than
50. - Notification Routing: Under the Actions panel, configure the state trigger flag to fire an automated Amazon SNS Topic push notification whenever the threshold gets breached, alerting your team instantly.
- Name the alert
DemoMetricFilterAlarm, hit next, and provision!
- Return to your metric filter configuration page and click Create alarm directly off your custom
End-to-End Flow
 ┌──────────────────────────────────────────────┐
 │     Nginx Web Server Access Log Group        │ ──► Raw HTTP lines flow from EC2 / Beanstalk
 └──────────────────────┬───────────────────────┘
                        │
                        ▼
 ┌──────────────────────────────────────────────┐
 │         Metric Filter Token Engine           │ ──► Continuously parses records for "400"
 └──────────────────────┬───────────────────────┘
                        │
             (⏱️ Matching Event Occurs)
                        │
                        ▼
 ┌──────────────────────────────────────────────┐
 │    Custom Namespace: MetricFilters           │ ──► Increments "MyDemoFilter" graph counter
 └──────────────────────┬───────────────────────┘     by +1 (Defaulting to 0 when clear)
                        │
                        ▼
 ┌──────────────────────────────────────────────┐
 │     Alarm Monitor (Breach: Count > 50)       │ ──► Automatically transitions status block
 └──────────────────────┬───────────────────────┘     from OK over to ALARM state
                        │
                        ▼
 ┌──────────────────────────────────────────────┐
 │         Amazon SNS Alert Broadcast           │ ──► Instantly pushes email or pager alerts
 └──────────────────────────────────────────────┘     straight to your on-call engineers