Provisioning the Microservice Stack via CloudFormation
Step 1: Upload the Simplified Stack Infrastructure
Go to the CloudFormation Console ──► click Create stack (with new resources).
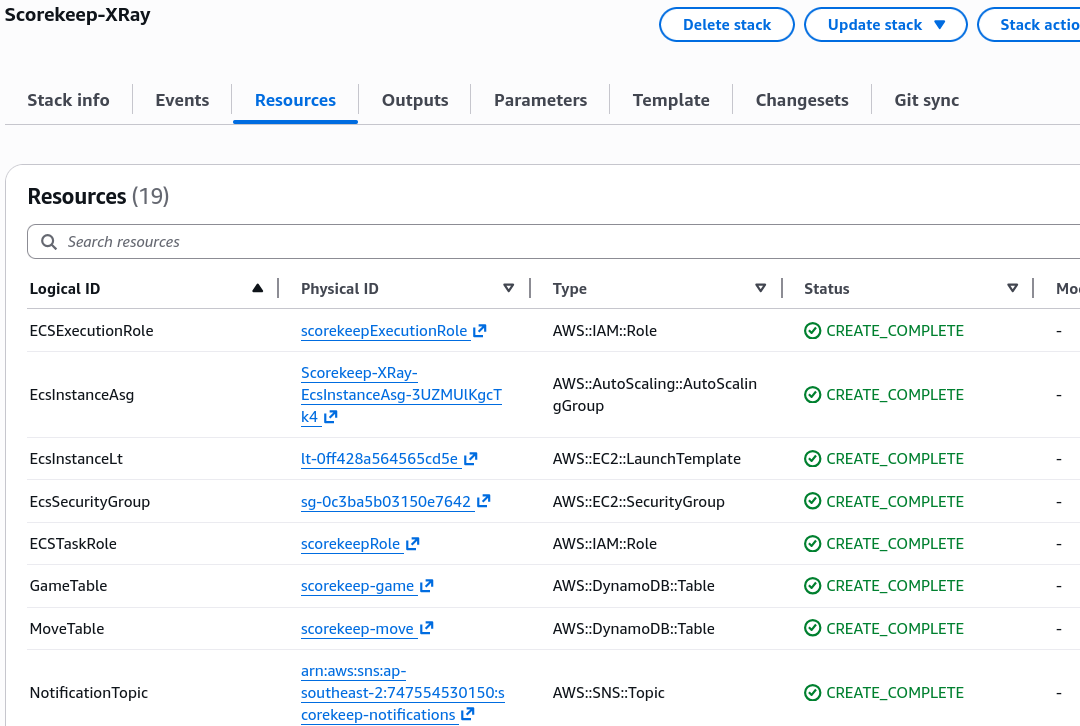
Choose Upload a template file and select your simplified template (EB_Java_Scorekeep_XRay_simplified.yaml). Name the stack Scorekeep-XRay.
Step 2: Bind Your Networking Parameters
Scroll to the parameter values block and map your target network layout coordinates:
SubnetID 1: Select your first available subnet.
SubnetID 2: Select your second isolated subnet channel.
VpcId: Bind your main default VPC environment routing hub.
Click next through settings, check the IAM capabilities acknowledgment box, and hit Submit to spin up your ECS Fargate tasks, Auto Scaling Groups, and DynamoDB backend assets.
Synthesizing Real Traffic & Interacting with the Live UI
Step 3: Boot Up the Frontend Client Application
Once your stack status flips to CREATE_COMPLETE, click the Outputs tab.
Copy the Application Load Balancer URL string and open it in a fresh browser tab to reveal the Scorekeep tracking game panel.
Step 4: Generate Production Trace Logs
Click Create to initialize a new game session framework.
Set your title to Sample Game ──► choose ruleset: Tic-Tac-Toe ──► hit create.
Click Play and slam random coordinates back-to-back across the grid matrix until an automated victory banner (X Wins!) pops up. This fires rapid-fire API backend payloads down through the data layer lanes!
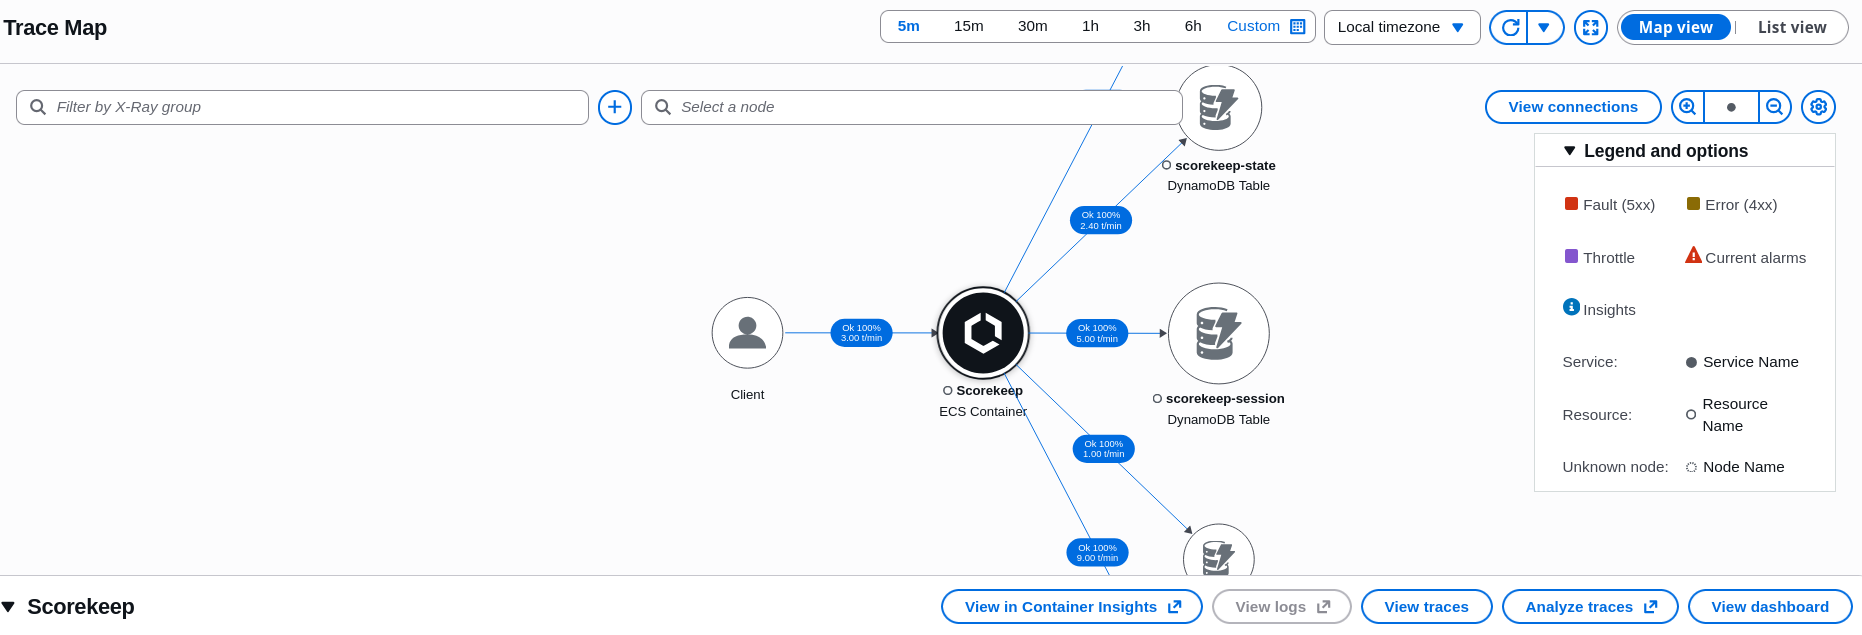
Navigate to CloudWatch ──► look under the Application Signals (APM) sidebar tier ──► select Trace Map.
Inspect the magically compiled topology tree. You can trace lines connecting the entry client to your ECS container instances, mapping down to multiple independent DynamoDB data store clusters (GameTable, SessionTable, StateTable) and SNS alerting pipes.
Step 6: Color-Coded Health Matrix Recognition
Observe the outer colored rings tracking your real-time processing responses:
Click View traces to jump into the query index dashboard.
Select a specific node (like the ScorekeepGameTable) and click Add to query to auto-populate the execution selector language. Click Run query to isolate just those paths.
Step 8: Drill Down into Individual Waterfall Timelines
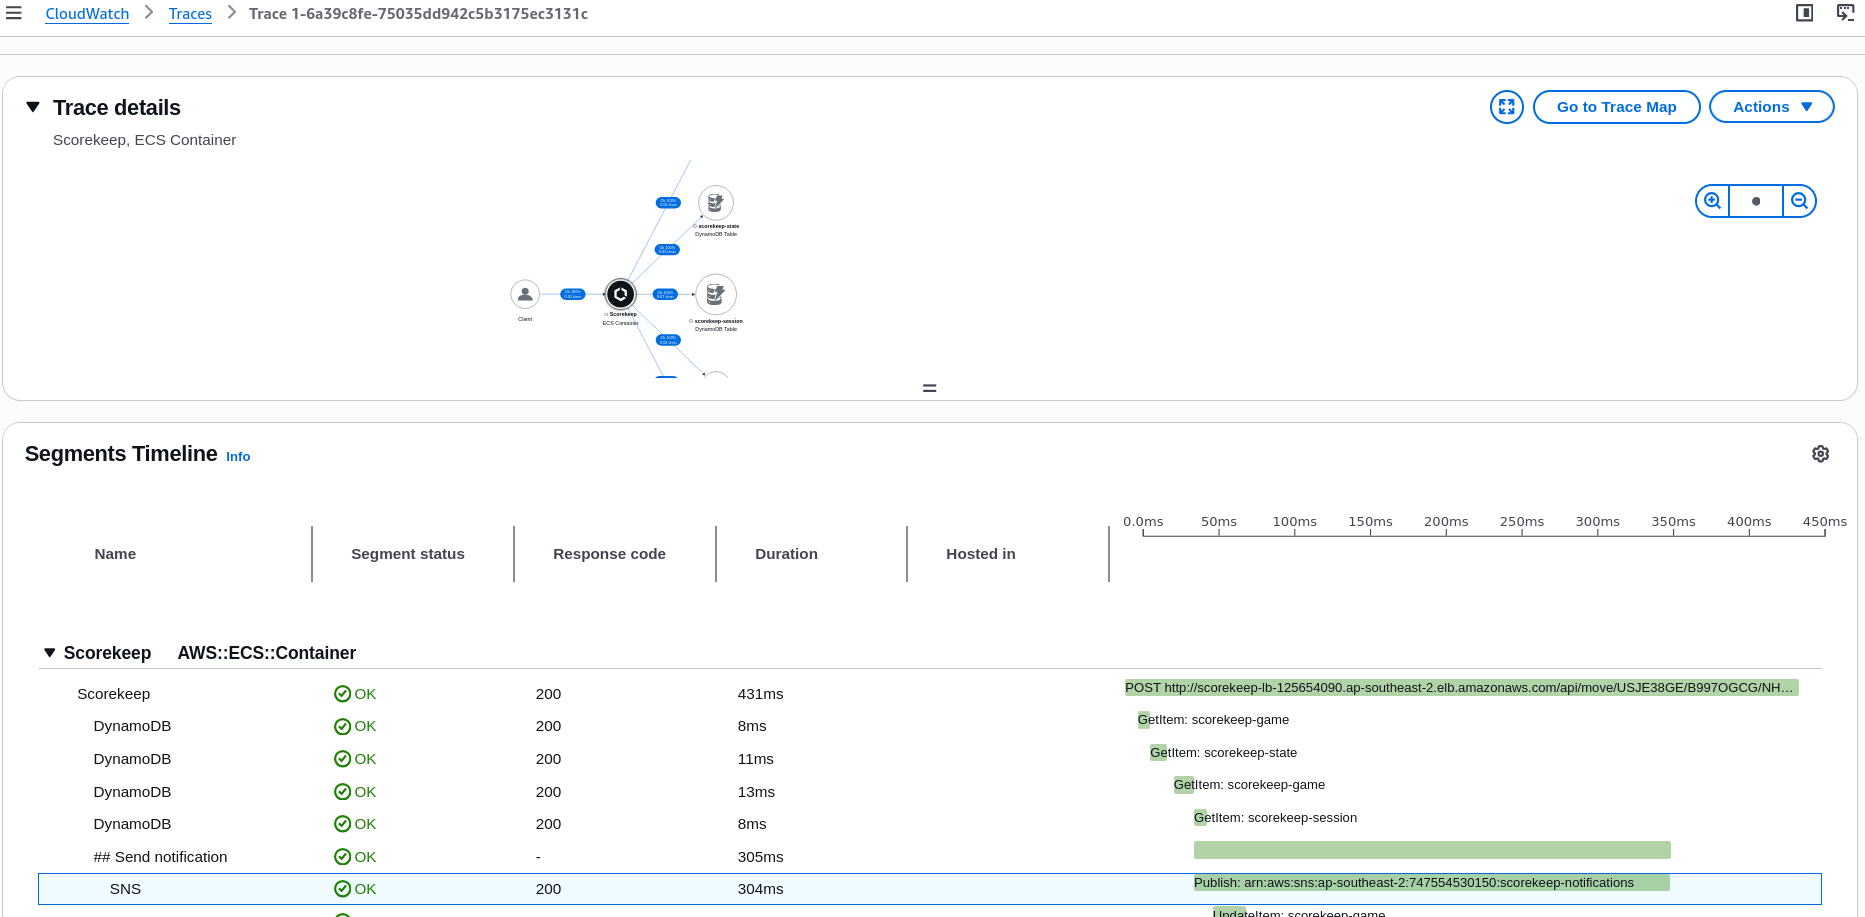
Click a trace tracking line from your filtered list to look inside the request details.
Scroll down to view the chronological segment and subsegment timeline matrix. This displays the exact layout breakdown of how a single user POST payload executed multiple sequential sub-operations (like checking the session state or updating the game database), measuring the exact response latency duration of each individual database call in milliseconds!