Lambda Asynchronous Invocations Hands On
🛠️ Step-by-Step Async Failure & DLQ Hands On
1. Generating the Async Signature via CLI
-
Step 1: Execute the Fire-and-Forget Strike
- Jump into AWS CloudShell and run an asynchronous invocation by explicitly passing the
--invocation-type Eventflag block:
aws lambda invoke \--function-name "demo-lambda" \--invocation-type Event \--cli-binary-format raw-in-base64-out \--payload '{"key1": "value1"}' \response.json - Jump into AWS CloudShell and run an asynchronous invocation by explicitly passing the
-
Step 2: Check the Return Status Packet
- Check your terminal output. Even if your function code is actively crashing or throwing unhandled exceptions, the CLI returns an immediate HTTP 202 Status Code:
{"StatusCode": 202,"ExecutedVersion": "$LATEST"}
2. Provisioning the Poison Pill Containment Unit (SQS)
-
Step 3: Spin up the Triage Buffer Queue
- Open Amazon SQS ──► click Create queue.
- Choose a standard queue layout and name it
lambda-DLQ. Leave all other timeout settings as default and hit create.
-
Step 4: Resolve the Core IAM Security Block
- If you try to bind this queue to your Lambda asynchronous configuration tab right now, the console will throw a red permission failure error, chief!
- To bridge the security gap, navigate to your Lambda function's Configuration -> Permissions tab and click your execution role link.
- Click Attach policies ──► search for and add
AmazonSQSFullAccess(or write a scoped policy allowingsqs:SendMessageto your specific queue ARN).
-
Step 5: Bind the Dead-Letter Queue
- Head back to the Lambda Console under Configuration -> Asynchronous invocation.
- Click Edit ──► scroll down to the Dead-letter queue wrapper selection ──► select SQS ──► pick your
lambda-DLQfrom the container index array and hit Save.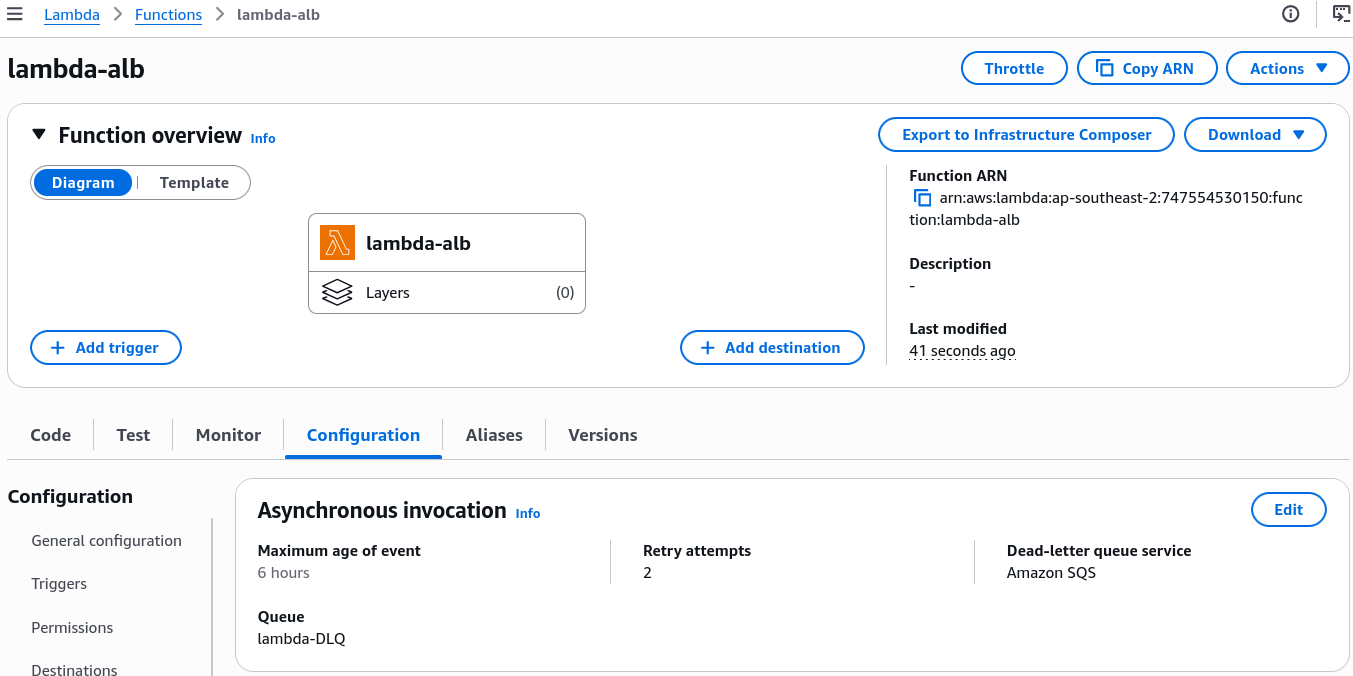
3. Tracking the Under-the-Hood Retry Matrix
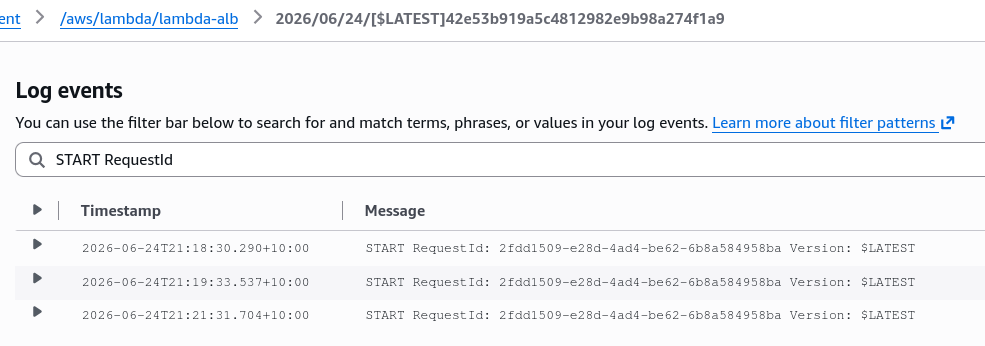
When you force your Node.js function to crash (using throw new Error("Something went wrong, bro!")) and trigger it via the CLI, Lambda executes its background retry schedule.
Open CloudWatch Logs and inspect your log streams. You will see three identical RequestID footprints execute across a rolling 3-minute window, chief:
4. Extracting Forensic Data from the DLQ Message
- Step 6: Poll the Poison Pill Bundle
- Head back over to your SQS Dashboard and select your
lambda-DLQ. - Click Send and receive messages ──► click Poll for messages.
- Click the intercepted payload item to analyze the structure.
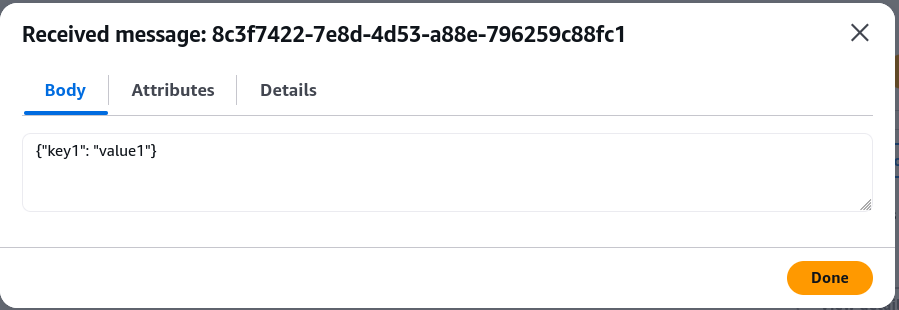
- Head back over to your SQS Dashboard and select your
- Step 7: Match the Correlation Attributes
- Open the Message Attributes configuration tab. Inside the metadata fields, you'll see two explicit diagnostic items packed into the message payload: 1.
ErrorCode/ErrorCause: Captures the high-level system code mapping why the execution environment bombed out. 2.RequestID: Matches the exact string identifier footprint found inside your CloudWatch execution log blocks, allowing you to instantly isolate and track down the precise stack-trace line in seconds, bro!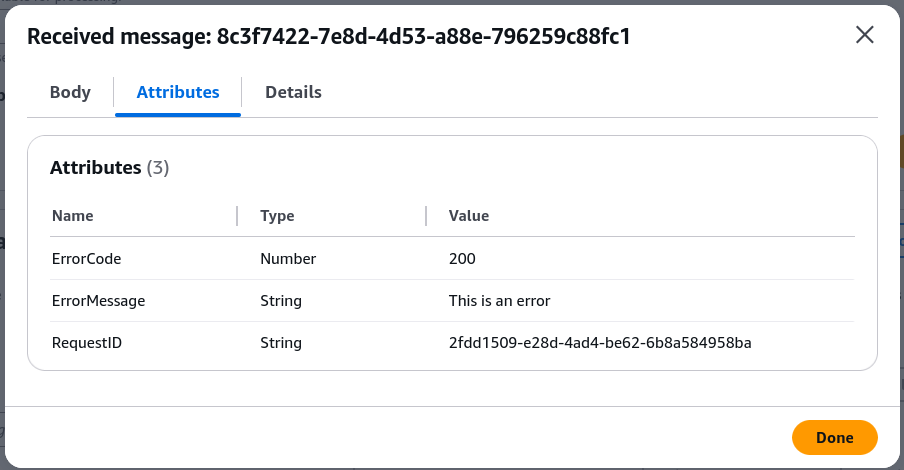
- Open the Message Attributes configuration tab. Inside the metadata fields, you'll see two explicit diagnostic items packed into the message payload: 1.
Exam Tips
- The Permission DLQ Pitfall: If a scenario states that a team turned on a DLQ for an asynchronous Lambda function, but failed processing payloads are vanishing into the ether instead of hitting SQS, check the IAM role. The Lambda Function Execution Role must explicitly be granted
sqs:SendMessageaccess, otherwise it cannot dump data to the queue! - Matching Log Signatures: Remember that throughout all automated retry phases, the
RequestIDremains identical. That's your primary anchor value when running diagnostic search filters across CloudWatch and SQS!