Lambda Monitoring & X-Ray Tracing
Mapping out your observability matrix using CloudWatch and AWS X-Ray is how you transform a blind, chaotic serverless environment into a perfectly auditable enterprise machine, bro! 🧠📊
When you shift from traditional servers to a microVM architecture, you can't just SSH into a box to run a thread dump or tail a local log file. You are completely dependent on cloud telemetry.
Key Takeaways
AWS Lambda telemetry breaks down into three distinct operational planes: CloudWatch Logs houses text-based stderr/stdout diagnostic print statements; CloudWatch Metrics records structural time-series performance data (like invocation counts, throttles, and stream lags); and AWS X-Ray Active Tracing utilizes an internal daemon container sidecar loop to profile end-to-end transaction paths, computing localized subsegment latency graphs across distributed microservice resources.
📊 The CloudWatch Metrics Inventory
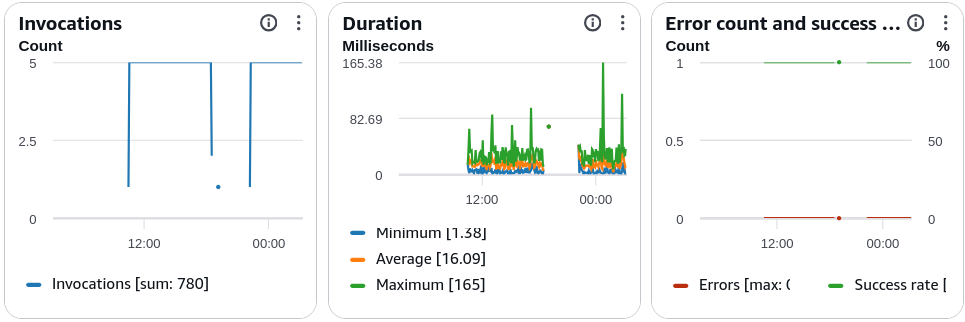
AWS Lambda streams performance metrics directly into CloudWatch. When you are analyzing system bottlenecks, these are the high-value indicators you must monitor:
- Invocations: The raw count of how many times your function code handler is executed.
- Duration: The exact millisecond lifespan it takes for your code to execute from start to finish.
- Errors: Captures any invocation that returns an application-level unhandled exception or runtime crash block.
- Throttles: Tracks requests blocked because your scaling footprint crashed straight into your account's Concurrency Limits.
- IteratorAge (For Streams): Absolute milestone exam metric! When reading from Kinesis or DynamoDB Streams via an Event Source Mapper, this measures the millisecond delay between when a record is written to the stream and when Lambda actually reads it. If
IteratorAgeis spiking, it means your Lambda function is running too slow to handle the incoming traffic velocity, causing a data backlog!
🕸️ AWS X-Ray Active Tracing Architecture
To trace transactions across a complex microservice landscape, you enable Active Tracing inside your function configuration panels.
⚙️ Operational Mechanics
- The Daemon Sidecar: When activated, Lambda automatically runs an internal AWS X-Ray Daemon worker inside your isolated microVM environment container shell.
- Outbound IAM Clearance: Your function’s IAM Execution Role MUST be granted the
AWSXrayDaemonWriteAccessmanaged policy (or carry the targetedxray:PutTraceSegments/xray:PutTelemetryRecordsAPI clearance) so the daemon can ship metrics upstream. - The Software SDK: You wrap your application import libraries (like the AWS SDK or database client) inside the X-Ray SDK wrapper code.
🔑 The 3 System-Injected X-Ray Environment Variables
The Lambda engine automatically populates three explicit system environment variables inside your container shell to guide the X-Ray SDK tracker. Memorize these indicators for the exam workspace:
_X_AMZN_TRACE_ID: Houses the active payload tracking sampling header string. The SDK reads this to correlate different downstream service operations to one single master transaction tree.AWS_XRAY_CONTEXT_MISSING: Instructs the SDK what to do if an execution happens but the master trace ID is missing (e.g., throw an exception or log a warning).AWS_XRAY_DAEMON_ADDRESS: Contains the precise network coordinate string (IP address and UDP Port number, typically127.0.0.1:2000) where the internal background X-Ray daemon is listening for telemetry dumps from your application code.
📊 Operational Telemetry Tracking Notation
The latency profiling boundaries and stream delay metrics evaluated by the monitoring plane align with these direct expressions:
Exam Tips
- The Spiking IteratorAge Remediation: If an exam scenario says: "An Event Source Mapping reads data from an Amazon Kinesis shard, but CloudWatch metrics indicate that
IteratorAgeis continuously increasing, causing severe downstream data delays. What should the developer configure to optimize throughput?" Look for options that tell you to increase the function's memory slider allocation (to make individual invocations faster) or increase theParallelizationFactorattribute on the Event Source Mapping to process multiple concurrent batches per shard in parallel. - The Missing Traces Authorization Pitfall: If a question states that a developer toggled "Active Tracing" on inside the Lambda console configuration page and wrapped their Node.js/Python code with the X-Ray SDK, but absolutely zero visual trace graphs are generating inside the AWS X-Ray console, look for the security option. The breakdown is happening because the Lambda function's IAM Execution Role is missing the
AWSXrayDaemonWriteAccesspolicy, blocking the daemon from authenticating its data uploads to the AWS security boundary!