Lambda Monitoring & X-Ray Tracing - Hands On
Stephane’s hands-on lab covers two massive pillars of real-world production triage: reading the CloudWatch Log REPORT line to check your financial and environmental efficiency, and analyzing the X-Ray Service Map to see how data actually jumps across infrastructure boundaries.
🛠️ Step-by-Step Observability and Tracing Hands On
1. Activating X-Ray Active Tracing Natively
- Step 1: Toggle the Infrastructure Daemon Sidecar
- Open your
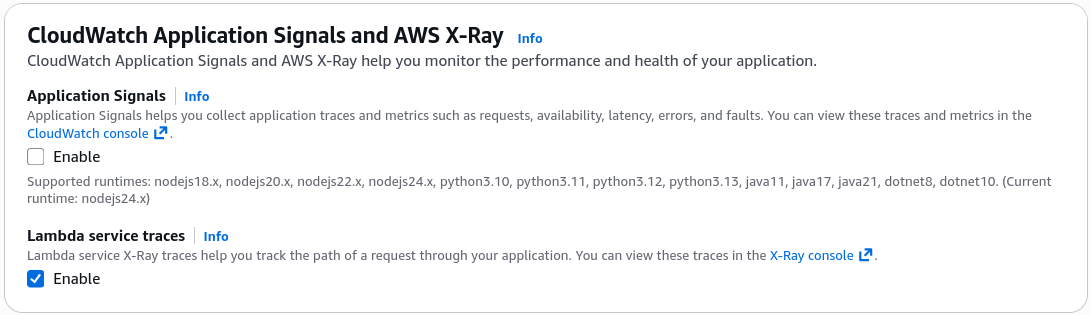
Lambda-S3function workspace ──► head over to the Configuration tab ──► select Monitoring and organization tools from the sidebar list. - Click Edit ──► toggle the switch for Lambda service traces to Enabled. Hit Save.
- Open your
- Step 2: Verify the Automatic Security Provisioning
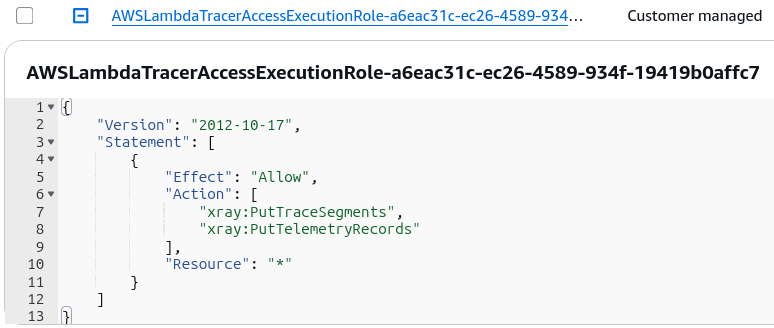
- Behind-the-Scenes Check: Click the Permissions tab and look at the role summary. The console automatically updates your function's IAM Execution Role, appendant with targeted permissions to execute
xray:PutTraceSegmentsandxray:PutTelemetryRecordsnatively. This ensures the background daemon container sidecar can push trace packages to the AWS security boundary.
- Behind-the-Scenes Check: Click the Permissions tab and look at the role summary. The console automatically updates your function's IAM Execution Role, appendant with targeted permissions to execute
2. Dissecting the CloudWatch Logs Forensic "REPORT" Line
Go to your CloudWatch Log Streams and look at the absolute end of any execution cycle. Every single Lambda run outputs a highly precise execution summary line labeled REPORT. It looks exactly like this, bro:
REPORT RequestId: abc123de-4567-890f-abcd-ef1234567890
Duration: 48.67 ms Billed Duration: 186 ms Memory Size: 128 MB Max Memory Used: 77 MB Init Duration: 136.54 ms
🧠 Core Financial & Compute Performance Metrics to Audit:
Durationvs.Billed Duration:Durationis the raw millisecond lifespan your code handler took to process. Lambda rounds this up to the nearest millisecond to calculate your preciseBilled Durationblock, ensuring you never pay for an extra microsecond of idle compute time!Memory Sizevs.Max Memory Used: If yourMemory Sizeslider is locked to 128 MB, but your logs reveal your code maxed out atMax Memory Used: 77 MB, your code is perfectly sized. But ifMax Memory Usedhits 128 MB, your function will hard-crash with an Out of Memory exception. Up the slider immediately.Init Duration(The Cold Start Clock): This tracks exactly how long it took the AWS container engine to download your code package, spin up the runtime environment shell, and execute your global outer initialization scripts before hitting your actual handler function. If this metric is missing, it means you hit a warm container (a fast Warm Start)!
🕸️ Analyzing the AWS X-Ray Service Map Visuals
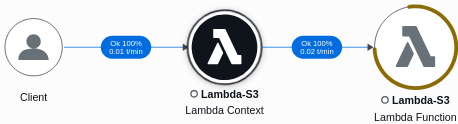
After restoring your code return block to a success state, dropping fresh object uploads into your S3 integration bucket, and opening up the AWS X-Ray Console, the platform generates a live visual transaction graph:
🔍 How to Read the Node Topology:
- The Client Node (The Trigger): Shows the initial asynchronous entry path where Amazon S3 detected the object creation state and handed off the transaction envelope.
- The Lambda Context Node: Represents the internal AWS Lambda front-desk orchestration engine receiving the payload.
- The Lambda Function Node: Represents your actual custom code handler block running inside the container microVM space.
- Color-Coded Status Rings:
- 🟤 Brown Blocks: Client Errors (4xx Error).
- 🔴 Red Blocks: Server Errors (5xx Error).
📊 Operational Telemetry Metric Formulations
The execution duration costs and cold-start boundary metrics verified during this console run evaluate under these clear expressions:
Exam Tips
- The Memory Sizing Audit Scenario: If an exam question asks you how to audit a massive library of 200 distinct company Lambda functions to verify which ones are over-provisioned (wasting budget by allocating too much RAM) or under-provisioned (running dangerously close to breaking memory boundaries), look for the option that tells you to parse and analyze the
REPORTlines inside CloudWatch Logs (or use tools like AWS Compute Optimizer). - Tracing Distributed Breakdowns: If an architectural design scenario describes a distributed pipeline where an S3 upload triggers a Lambda function, which writes to an SQS queue, which then triggers a secondary Lambda function to write cells down into DynamoDB, and developers need to track down exactly which step in this long chain is introducing an intermittent 4-second latency delay—look for AWS X-Ray Active Tracing on the Service Map immediately!